Energy Production: Solar and Oil & Gas

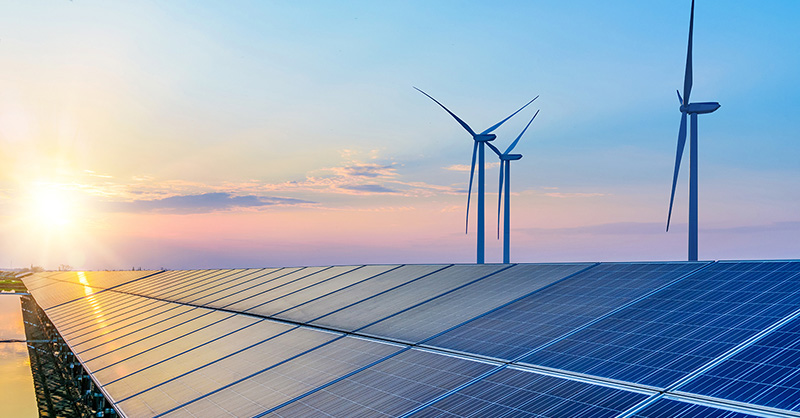
The United States has seen significant advancements in both solar energy and oil & gas production in recent years. Driven by declining technology costs and supportive federal policies, solar energy production has surged. While the percentage of electricity generated from solar is modest, solar represents the largest source of new electricity generation in the U.S. according to the US Department of Energy. In 2023, photovoltaics (PV) represented approximately 54% of new U.S. electric generation capacity, compared to 6% in 2010. Industry analysts monitor trends in the residential, commercial and utility sectors. While the utility sector drives the growth, residential installations have consistently trended upward. According to the Department of Energy, at the end of 2023, there were nearly 5 million residential photovoltaics (PV) systems in the United States. Solar is also national in scope. While the US as a whole generates only 5.6% of electricity from solar, there are now eight states that generate more than 10% of their electricity from solar: CA, NV, MA, VT, HI, UT, RI and AZ.
Despite the growth of renewable energy sources, oil and gas continue to provide more than two-thirds of the energy Americans consume daily according to the Energy Information Administration (EIA). The country’s ability to produce oil and natural gas has grown dramatically in the last 20 years due in large part to technological advancements. These changes have transitioned the US from an energy importer to a net energy exporter. Annual energy production has exceeded total energy consumption since 2019.
These trends highlight the importance of innovative insurance solutions to support the expanding infrastructure needs of the energy sector.
With our Clean & Green Solar Energy coverage form, Property & Inland Marine can protect the contractor installing the new solar panels on residential and commercial properties during the installation phase as well as the completed operating permanent arrays for solar fixed and moving panels. Learn more about our Solar Energy coverage here:
We also provide a competitive and flexible policy that goes beyond the basics with automatic coverage for the unexpected to protect oil & gas equipment. Learn more about our Oil & Gas Equipment Insurance here:
To analyze the energy profiles of all 50 states, check out the EIA’s State Energy Portal. On the portal, you can view energy indicators for each state. The Renewable Energy Dashboard allows you to look at existing renewable installations by state.
4 U.S. Energy Information Administration (EIA), Total Energy, Primary Energy Overview


